Previous: Overview Report
inSITE VM allows you to quickly calculate interactive reports on outstanding vegetation risk and integrated vegetation management in your system.
Creating or Selecting an Ambit
inSITE calculates detections within the boundaries of an ambit. If you’re not familiar with ambits in inSITE, see What is an Ambit? for more information.
Open the Vegetation Management widget ![]() and click the Distribution or Transmission tab, depending on which type of utility infrastructure you’re working with. Create or select an ambit using one of the following methods.
and click the Distribution or Transmission tab, depending on which type of utility infrastructure you’re working with. Create or select an ambit using one of the following methods.
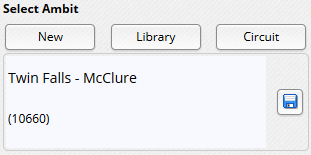
Click the New button to create a new ambit by drawing on the map. For more information on drawing ambits, see Creating an Ambit. After you’ve defined your ambit boundaries, inSITE will create a temporary ambit. Click Create New again to discard your temporary ambit and draw new ambit boundaries or click Save to save your ambit to the ambit library. You may save a temporary ambit at any point. You may proceed to the next step and calculate vegetation analytics using a temporary ambit if you're not sure whether you want to save or discard.
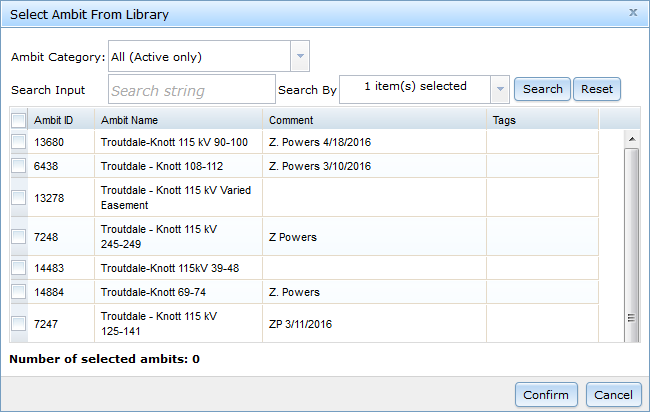
Click the Library button to select an existing ambit from your library. Use the Ambit Category menu to choose from Predefined ambits available to all users, Active ambits in your personal library, Owned ambits that you created and saved, or Shared ambits other users have shared with you. In the Select Ambit from Library window, click on an ambit to preview it in the map. Click Confirm to select the ambit.
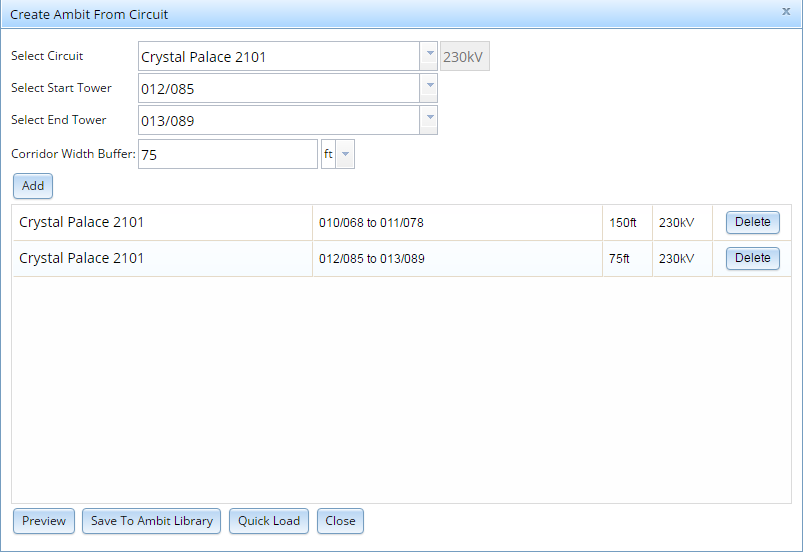
Click the Circuit button to create a new ambit by selecting part or all of a circuit. In the Create Ambit from Circuit window, start typing the name of a circuit in the Select Circuit dropdown menu and click on the desired result to select it. Select start and end points for your ambit using the Select Start Tower and Select End Tower dropdown menus. Enter a value in the Corridor Width Buffer box and select width units using the dropdown menu to adjust the width of the ambit generated around the selected circuit. The Corridor Width Buffer setting measures from the span centerline outwards in one direction, which means a width buffer of 150 ft will produce an ambit 300 ft wide centered on the span centerline. Click Add to add the circuit segment to your ambit. Repeat the process to add more segments from the current circuit or another circuit to your ambit.
Click Preview to see the current ambit boundary in the map window. Click Save to Ambit Library to save your ambit and select it in the Veg Management widget. Click Quick Load to create a temporary ambit with the currently displayed boundaries. Click Close to cancel and exist the Create Ambit from Circuit window.
Filtering by Voltage (Distribution Only)
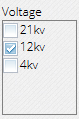
By default, inSITE VM will calculate detections analytics for all spans in the selected ambit. Uncheck boxes in the Voltage menu to exclude results for those voltages.
Filtering by Detection Type (Transmission Only)
Transmission calculations include calculations for four types of vegetation analytics: routine detections, orchard detections, cage clearance detections, and integrated vegetation management (IVM) polygons. Please see Vegetation Management Data Layers for more information on vegetation analytics.
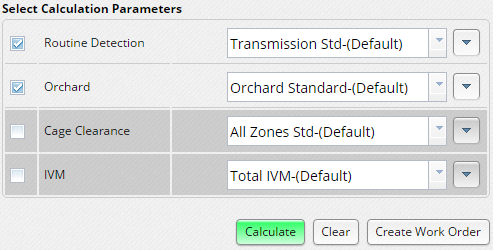
By default, inSITE VM will calculate for all types of vegetation analytics for all spans and IVM polygons in the selected ambit. Uncheck boxes in the Select Calculation Settings menu to exclude results for those vegetation analytics.
Selecting Detection Parameters
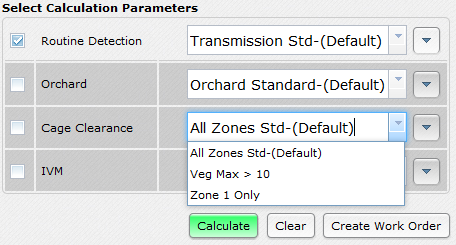
Select an option from the Detection Parameters dropdown menu to determine which criteria to use to calculate vegetation analytics for each analytics type. Your inSITE VM account includes at least one set of detection parameters configured by your organization’s inSITE administrator.
To view details for a set of detection parameters, select it from the Detection Parameters drop down menu then click the edit menu and choose Edit.
inSITE VM allows users to create custom detection parameters to meet specific project or regional needs. For more information about custom detection parameters, see Defining Analytics Parameters.
Viewing Vegetation Analytics
After you’ve selected an ambit, set filters, and selected detection parameters, click the Calculate button. inSITE VM will calculate a count of all vegetation analytics in the selected ambit for your selected parameters. inSITE VM calculates results for all detections with treetop that fall within the selected ambit and for all IVM polygons within the ambit, including polygons that fall partially within the ambit. inSITE VM categorizes results based on their work management status: the results tables show counts for the number of remaining results identified by LiDAR analysis, the number of results not currently assigned to a forester or other field worker, the number of results assigned to a forester or other field worker through a work order, the number of field-validated results that don't require tree work, the number of field-validated results that do require tree work, and the number of results with tree clearance, or trim, work complete.
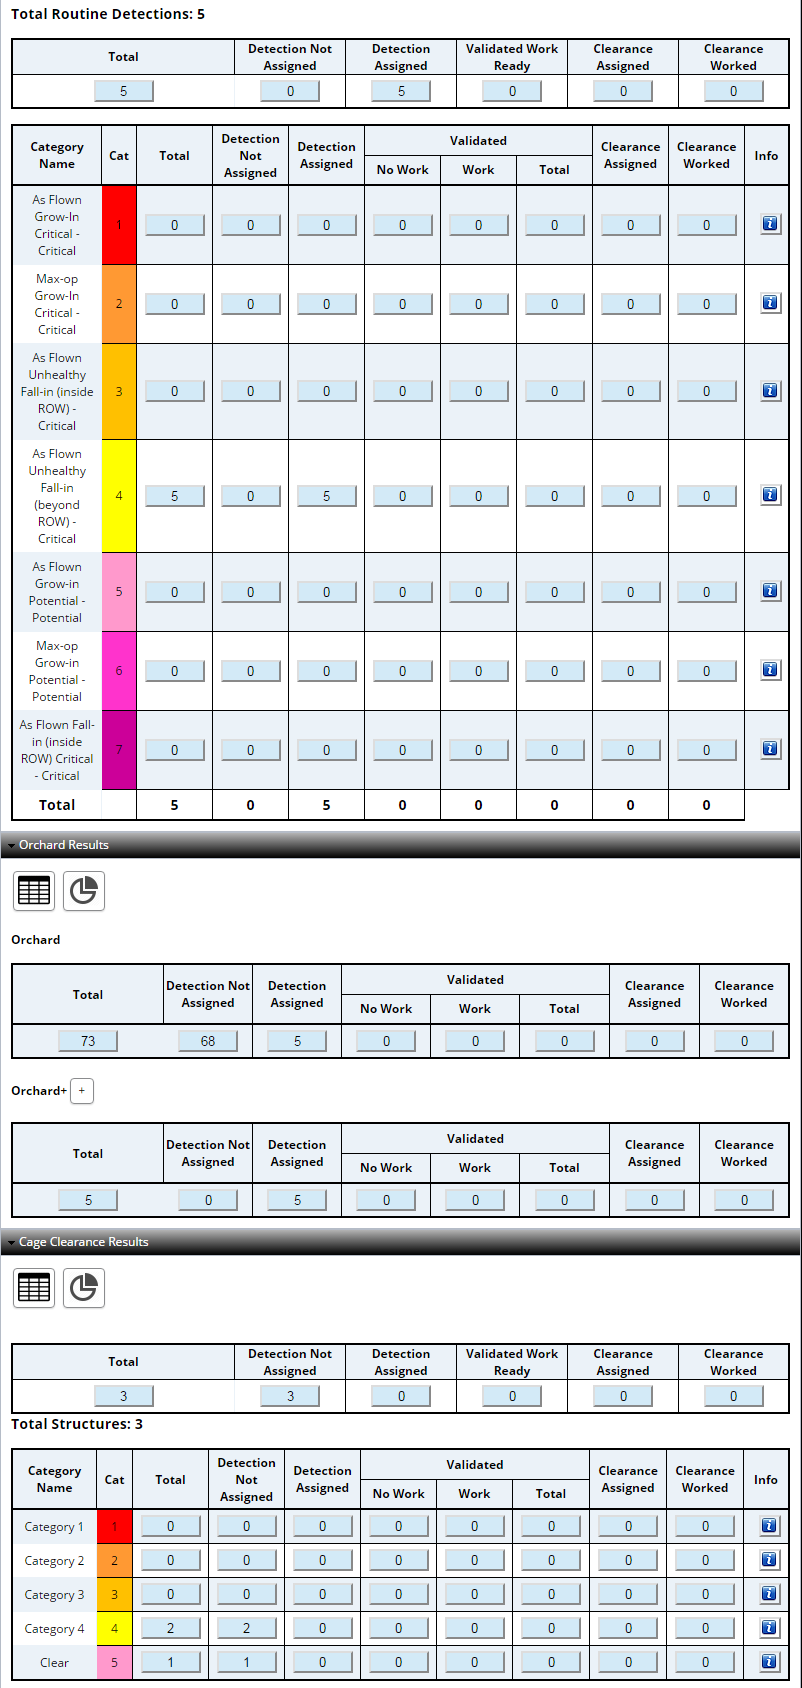
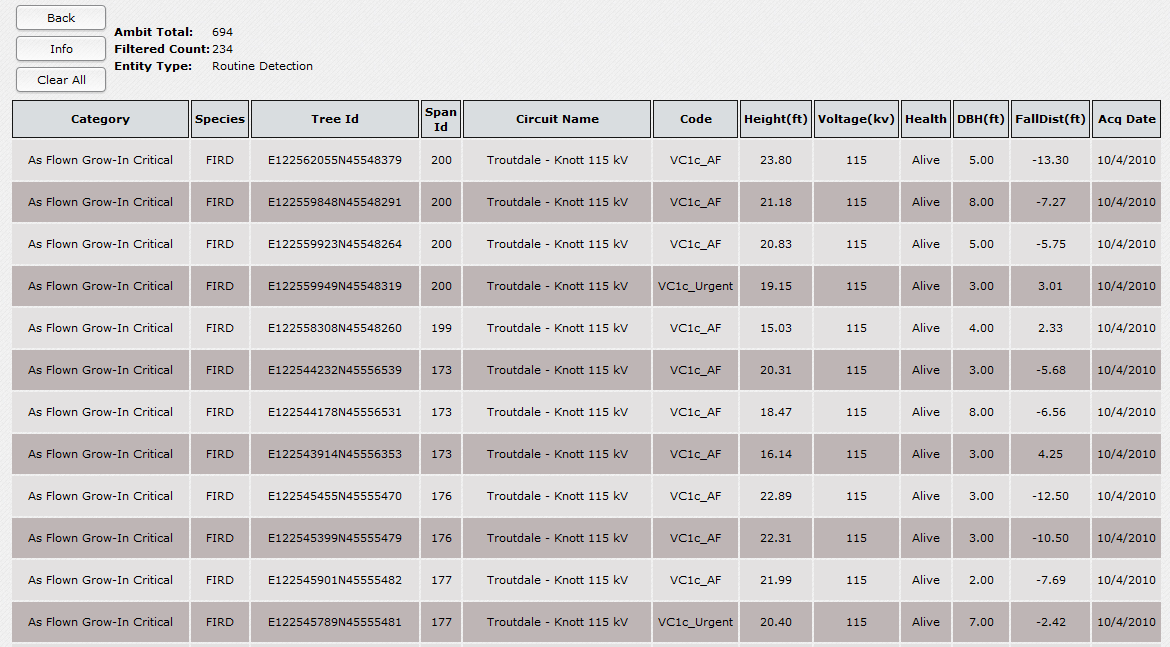
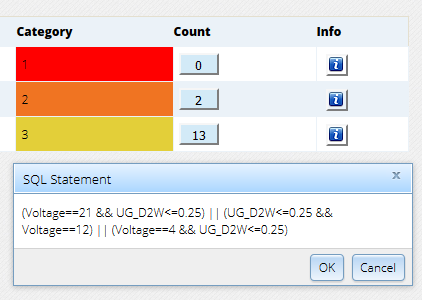
inSITE returns a table of analytics categories prioritized according to the selected detection parameters. Click the count button for any category with one or more results to open a smart table listing details for each detection result in the category. Click any column header to filter results by the attributes listed in the column. Click Info to view the currently applied filters. Click Clear All to remove the current filters. Click any row in the table to highlight the corresponding detection in the map and pan the map to the detection’s location. Click the Back button to return to the overall detection results.
Click the info button for any category to view the parameters used to calculate results. Detection parameters are displayed as SQL statements. For more information about detection parameters, see Defining Analytics Parameters. Click OK to close the SQL Statement window and return to the overall detection results.
To recalculate vegetation analytics, select or create a different ambit, check or uncheck filter boxes, or select a different set of detection parameters then click the Calculate button.
Orchard Detections Results by Zone
Orchard detections use special parameters based on zones within a span to determine which trees represent a potential hazard. Orchard detections parameters combine the maximum tree height (MTH) allowable in each span zone with a tree growth buffer determined by tree species. The MTH is measured from the lowest point on the modeled, or maximum operation condition, conductor in each zone, and the MTH clearance requirement is determined by the line voltage. The tree growth buffer added to the MTH is 10 feet for walnut trees and 8 feet for all other orchard tree species. Any orchard tree with a highest point that encroaches into the growth buffer or MTH is considered an orchard detection.

Cage Clearance Heights by Zone
![]()
inSITE's cage clearance analytics display color-coded maximum vegetation heights by cage zone to quickly indicate the level of potential risk in each zone. For more information about cage clearance zones and other analytics parameters, see Defining Analytics Parameters.
inSITE color codes maximum vegetation height according to the values in the table below.
| Color | Max. Veg. Height |
| Red | 10 ft. or Higher |
| Orange | 3-10 ft. |
| Yellow | 1.5-3 ft. |
| None | 1.5 ft. or Shorter |
0 Comments