Previous: InSITE VM Workflow Quick Start Guide
Quantum inSITE VM displays data layers for the following types of vegetation management features: vegetation detections, utility towers, circuits, vegetation outlines, cage clearance detections, and integrated vegetation management (IVM) polygons. Quantum inSITE VM may display additional asset or analytics layers like access roads or land cover classification when available.
Detection Treetop Tracking
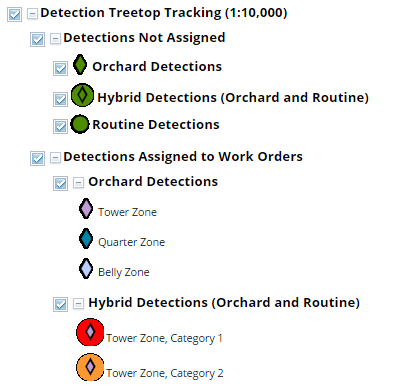
The detection treetop tracking layer displays an icon at the highest point of each canopy unit identified as a vegetation detection in Quantum Spatial’s LiDAR analytics. The symbology for the icon indicates the current work management status of each detection tree.
Detection data displayed in inSITE reflects LiDAR analytics results and field validation results from mobile apps. The displayed detections do not reflect reconciliation with historic management records from a vegetation management database. All detections identified by LiDAR analytics display in the map, so the detections feature may display obstructions that were managed by your utility's vegetation management team or trim contractors after the date of the LiDAR survey, depending on your utility's data integration strategy with inSITE.
The detection treetop tracking layer displays the following types of detections:
- Routine Detections: Trees of any species or unidentified species that represent a potential conductor encroachment or fall-in hazard.
- Orchard Detections: Trees of a known orchard species that represent a potential encroachment on the maximum tree height zone for a span running through an orchard.
- Hybrid Detections: Trees that meet the criteria for both routine and orchard detections. These are trees of a known orchard species that represent a potential encroachment on the maximum tree height zone for a span running through an orchard and a potential conductor encroachment or fall-in hazard.
Towers
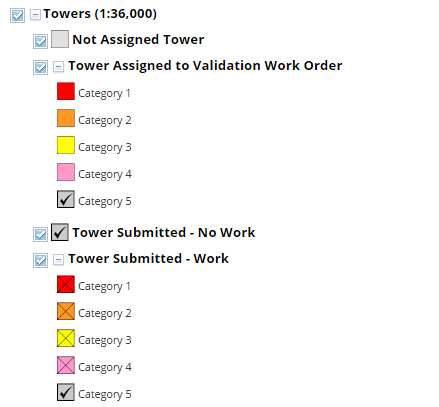
The towers layer displays utility tower center points and names and work management status for vegetation encroachments on the tower, also known as cage clearance status. As with tree detections, cage clearance data displayed in inSITE reflects LiDAR analytics results and field validation results from mobile apps.
Circuits
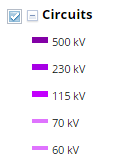
The circuits layer displays 2D span centerlines for each circuit. The span centerlines are drawn from tower top to tower and do not represent the location of the conductors.
All Treetops
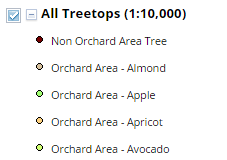
The All Treetops layer displays an icon at the highest point of each canopy unit identified in Quantum Spatial’s LiDAR analytics. This includes trees identified as routine or orchard detections as well as trees that were not flagged by LiDAR analysis as potential hazards. All Treetops points are attributed with the minimum ground-to-conductor clearance distance, or MGCC, at the closest point on a conductor to the canopy unit and with coordinates for the conductor and ground points used to calculate ground-to-conductor clearance.
IVM
The IVM layer displays the centroids and LiDAR-derived outlines of vegetation areas that are highly likely to qualify as examples of Integrated Vegetation Management. The IVM layer displays analysis based on the height and area of the vegetation - vegetation species is not included in the analysis at this time.
Veg Detection Polygons
The veg detection polygons layer layer displays LiDAR-derived outlines representing the canopy areas of individual trees or canopy units.
Cage Clearance Zones
The cage clearance zones layer displays the 2D areas around each utility tower that are used to classify vegetation encroachments on the tower.
Next: Overview Report
0 Comments